Beyond the Data: How to Analyze Campaign Reports

Mastering the Campaign Report: Why Data is Your Secret Weapon
In the world of digital marketing, data is everywhere, but clarity is rare. You’ve likely spent weeks or months pouring your budget into a new strategy, and now the results are in. But here is the hard truth: a stack of numbers isn’t a strategy. Knowing how to analyze campaign report data is the only way to turn those raw figures into a roadmap for growth. Without a proper “post-game” analysis, you’re essentially flying a plane without a dashboard you might be moving, but you have no idea if you’re heading toward a destination or a cliff.
The difference between a mediocre marketer and a top-tier strategist lies in how they interpret digital marketing reporting. It isn’t just about looking at how much you spent; it’s about uncovering data-driven insights that explain why a customer clicked or why a specific lead didn’t convert. When you sit down to figure out how to analyze campaign report metrics, you aren’t just looking for “vanity metrics” like likes or impressions. You are looking for marketing ROI the tangible proof that your efforts are moving the needle for the business.
In this guide, we’ll move past the surface-level charts. We are going to explore a systematic approach to how to analyze campaign report structures so you can stop guessing and start scaling. Whether you are reporting to a skeptical boss or trying to optimize your own small business spend, mastering this process will change the way you look at every dollar you spend.
Setting the Stage: Preparation for How to Analyze Campaign Report Success
Before you can pull meaningful insights, you need to ensure the data you’re looking at is actually accurate. If your tracking is broken, even the most sophisticated marketing campaign analysis will lead you to the wrong conclusions. To truly understand how to analyze campaign report data, you have to start with the “plumbing” the technical setup that happens long before the first ad goes live.
The most common pitfall in digital marketing reporting is messy data. This usually stems from inconsistent UTM parameters. If one team labels a source as “Facebook” and another uses “fb_ads,” your report will be fragmented, making it nearly impossible to see a unified campaign performance report. High-quality analysis requires “clean” data, where every click is correctly attributed to its specific source, medium, and creative asset. Without this, your advertising ROI analysis is just a guessing game.
Another critical step is configuring your Google Analytics 4 (GA4) properties correctly. Unlike older versions of analytics, GA4 is event-based, meaning you have to explicitly tell it what actions like a form fill or a whitepaper download count as a “conversion.” When you know how to analyze campaign report structures within GA4, you can see the entire customer journey mapping process, from the first touchpoint to the final sale.
Finally, you cannot judge performance in a vacuum. You need campaign benchmarking techniques to provide context. Is a 2% click-through rate (CTR) good? It depends on your industry and your historical performance. By setting these benchmarks early, you create a “North Star” for your data-driven marketing strategy. This preparation ensures that when you finally sit down to figure out how to analyze campaign report results, you aren’t just staring at numbers you’re measuring progress against a concrete goal.
The Step-by-Step Framework: How to Analyze Campaign Report Data
When you sit down to figure out how to analyze campaign report results, the sheer volume of data can be paralyzing. To avoid “analysis paralysis,” you need a repeatable framework that filters out the noise. This isn’t about looking at every single row in a spreadsheet; it’s about a disciplined sequence that moves from the “big picture” down to the granular details. Here is how to navigate a campaign performance report like a seasoned strategist.
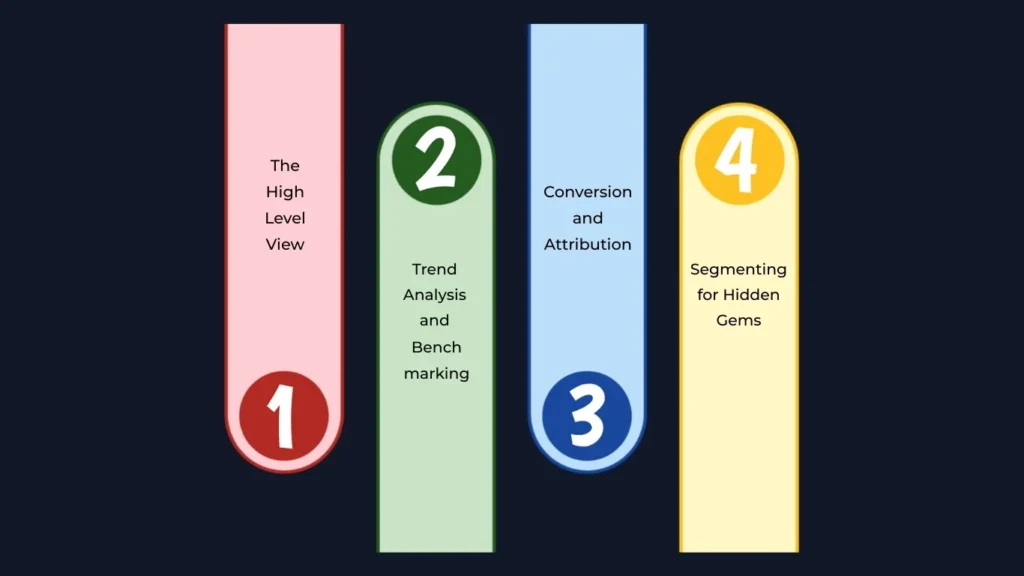
Step 1: The High-Level View
Start at the top. Before diving into specific ads, look at your overall advertising ROI analysis. Compare your total ad spend allocation against the revenue or leads generated. This is where you calculate your “North Star” metrics: Return on Ad Spend (ROAS) and Cost Per Acquisition (CPA). If your goal was to acquire customers at $50 each and the report shows $75, you immediately know where to focus your energy. This high-level check tells you if the campaign is healthy or if it needs emergency surgery.
Step 2: Trend Analysis and Benchmarking
Data without context is meaningless. To truly understand how to analyze campaign report data, you must look at period-over-period (PoP) growth and year-over-year (YoY) shifts. Did your click-through rate (CTR) drop because of a seasonal slump, or is your creative wearing out? By comparing current performance against historical campaign benchmarking techniques, you can tell if a 5% dip is a crisis or just a standard Tuesday in your industry.
Step 3: Conversion and Attribution
Next, look at the “hand-off” between your marketing and your website. This is where conversion rate optimization (CRO) comes into play. If your ads have a high CTR but nobody is buying, the problem isn’t the ad it’s the landing page. Furthermore, modern marketing isn’t linear. You must use multi-channel attribution modeling to see how different platforms work together. Perhaps your YouTube ads didn’t get the final “click,” but they introduced the brand, making your Search ads more effective later.
Step 4: Segmenting for Hidden Gems
Finally, go deep into customer journey mapping. Segment your data by device (mobile vs. desktop), geography, and audience interest. You might find that while the overall campaign is average, your ads are performing 300% better with a specific age group. This is the “Eureka!” moment of how to analyze campaign report data: finding the specific segments that are driving the most value so you can double down on what works.
By following this four-step process, your marketing campaign analysis transforms from a chore into a competitive advantage. You stop reporting on what happened and start predicting what will happen next.
Identifying Actionable Insights from Your Campaign Performance Report
Once the data is laid out, the real work begins. The goal of knowing how to analyze campaign report data isn’t just to archive it, it’s to find the “so what.” An insight is only actionable if it tells you exactly what to change tomorrow morning. This stage of marketing campaign analysis is where you separate the signals from the noise and decide where your next dollar should go.
First, look for your winners through A/B testing results. In any given campaign, you likely ran multiple headlines, images, or calls to action. When you look at how to analyze campaign report segments, identify which creative drove the highest quality traffic. If “Creative A” has a lower click-through rate (CTR) but a much higher conversion rate than “Creative B,” you’ve found a high-intent audience. This is a clear signal to shift your ad spend allocation toward the creative that actually closes the deal, rather than the one that just gets clicks.
On the flip side, you must be ruthless about identifying underperforming ad sets. It is tempting to let a “mediocre” ad run in hopes it will improve, but a disciplined campaign performance report review will show you where you are leaking cash. If a specific audience segment has a skyrocketing cost per acquisition (CPA) compared to your benchmarks, it’s time to pause and pivot. By continuously performing this advertising ROI analysis, you ensure that your budget is always flowing toward the most efficient path.
Finally, look for “efficiency gaps.” Sometimes a campaign looks successful on the surface, but a deep dive into how to analyze campaign report metrics reveals that your CPA tracking is higher than the customer’s lifetime value. Use these data-driven insights to suggest structural changes. Maybe you need to tighten your keyword targeting or exclude certain geographic regions that browse but never buy. This proactive approach turns a standard digital marketing reporting session into a high-level strategy meeting that actually impacts the bottom line.
Visualization and Stakeholder Communication
Data is only as powerful as your ability to explain it. You can spend hours mastering how to analyze campaign report data, but if you present a cluttered spreadsheet to a client or executive, your insights will likely be ignored. The final stage of a successful marketing campaign analysis is translation—turning complex numbers into a narrative that stakeholders can understand and act upon.
The most effective way to bridge this gap is through data visualization tools. Platforms like Looker Studio, Tableau, or even well-designed CRM dashboards allow you to transform raw digital marketing reporting into visual stories. Instead of showing a table of 500 rows, show a trend line that clearly illustrates period-over-period (PoP) growth. Visualization helps stakeholders see the “big picture” of the campaign performance report at a glance, allowing them to focus on results rather than getting lost in the weeds of UTM parameters or technical jargon.
When considering how to explain marketing data to stakeholders, remember that they generally care about three things: What happened? Why did it happen? What are we doing next? Use your advertising ROI analysis to lead with the bottom line. If the Return on Ad Spend (ROAS) increased by 20%, start there. Then, use your data-driven insights to explain the “why” perhaps it was a specific shift in ad spend allocation or a breakthrough in A/B testing results.
Finally, always conclude with a clear recommendation. Don’t just show them how to analyze campaign report findings; tell them how those findings impact the future. Whether it’s requesting a budget increase for a high-performing channel or suggesting a pivot in the data-driven marketing strategy, your communication should always point toward growth. By pairing high-level campaign performance report data with clear, visual storytelling, you turn a routine update into a strategic consultation that builds trust and proves your value.
Conclusion: Turning Analysis into Action
Learning how to analyze campaign report data is more than a technical skill; it is a competitive mindset. In an industry where trends shift overnight, the ability to look at a campaign performance report and see the story behind the numbers is what defines a successful marketer. We’ve moved from the vital groundwork of data hygiene and UTM parameters to the high-level strategy of multi-channel attribution modeling, proving that every data point is a clue toward better performance.
As you move forward, remember that marketing campaign analysis is not a one-time event at the end of a month. It is a continuous cycle of curiosity. Every advertising ROI analysis you conduct should lead to a new question: Can we lower our cost per acquisition (CPA) even further? What did our A/B testing results teach us about our audience’s pain points? By consistently applying these data-driven insights, you ensure your marketing remains agile, efficient, and, most importantly, profitable.
The goal isn’t just to report on the past but to dictate the future. When you truly understand how to analyze campaign report metrics, you stop reacting to the market and start leading it. Use the tools, frameworks, and campaign benchmarking techniques we’ve discussed to build a foundation of transparency and growth. If you’re looking for professional support to scale these efforts, you can explore our Services or check out our guide on Google Analytics 4 setup to ensure your data is accurate from day one. Now, take these insights, open your latest report, and start uncovering the opportunities that others are missing.