
Google Analytics Report: A Simple Beginner’s Guide for 2026
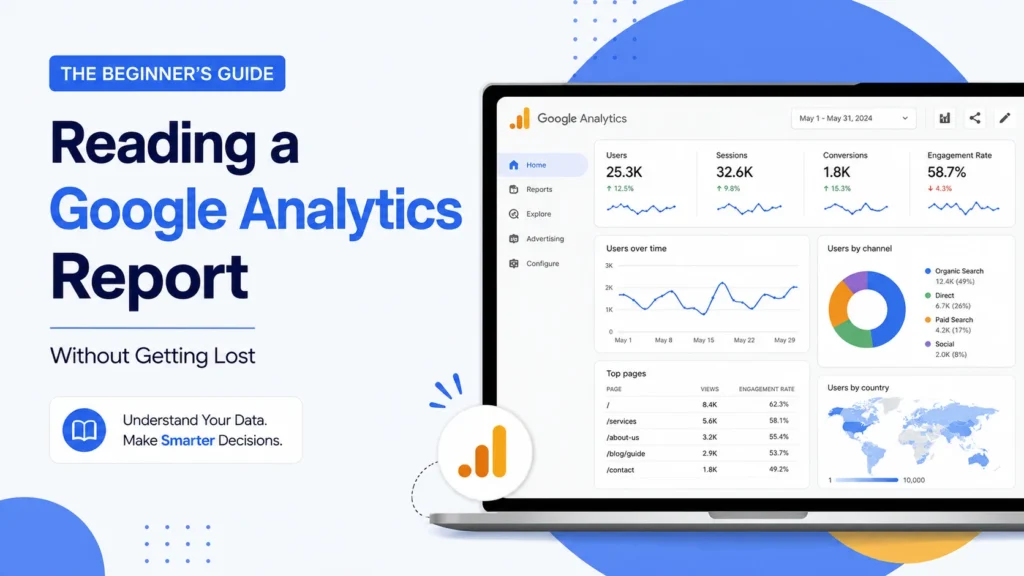
Opening a Google Analytics report for the time feels like walking into a cockpit. There are dozens of numbers, graphs and tabs competing for attention. Most founders. Ignore the dashboard or stare at the “Users” number without understanding why. This guide breaks down what to look at in a Google Analytics report in terms.
Why Most People Get Lost in a Google Analytics Report
The current Google Analytics version, GA4 is built differently. It tracks events, not sessions. The interface doesn’t make it easy to find numbers. That’s why a Google Analytics report feels overwhelming.
The Only Four Sections of a Google Analytics Report Worth Starting With
Acquisition: Where Your Visitors Are Coming From
This section answers one question: how do people find your website? It breaks traffic into channels like search, ads, social media and referrals.
Engagement: What People Actually Do Once They Arrive
Traffic numbers alone don’t tell much. This section shows how long people stay, which pages they visit and where they drop off.
Conversions: Whether Visitors Are Actually Doing What You Want
This section tracks actions you define as valuable like form submissions or purchases. Without conversions the report just shows activity.
Tech: Whos Visiting and How
This part shows visitor age range, location and device type. It’s less about decisions and more about spotting patterns.
How to Actually Read a Google Analytics Report Without Overthinking It
- Start with one question, not the dashboard. Pick a question like “where’s my traffic coming from this month” or “which pages are people leaving from fastest.”
- Compare time periods, not totals. A single number rarely means much. What matters is direction. Is traffic up or down compared to month?
- Don’t chase every metric. Most businesses only need to check acquisition, engagement and conversions
Common Mistakes Beginners Make With Google Analytics Reports
- Judging performance by the “Users” number without checking what those users did.
- Never setting up conversion tracking making the report less useful.
Quick FAQ: Reading a Google Analytics Report
What’s the fastest way to get comfortable reading a Google Analytics report?
Start with Acquisition and Engagement sections.
Why does my Google Analytics report show numbers than my ad platform?
Google Analytics and ad platforms track differently.
Do I need to check my Google Analytics report every day?
No, weekly or bi-weekly reviews are usually enough.
Is GA4 the same as the Google Analytics?
No GA4 is a measurement model.
Where can I learn more about reading Google Analytics ?
Googles Analytics Help Center and free Analytics Academy courses.
How Rebootiq Helps Businesses Make Sense of Their Data
At Rebootiq we review Google Analytics reports in every SEO and Google Ads engagement. A set-up Google Analytics report turns guesswork into decisions your team can act on.
Not sure if your analytics setup is tracking what actually matters? Get a website and tracking audit.
Thanks, for choosing Rebootiq InfoTech.
